MIT Computer Science & Artificial Intelligence Laboratory
Department of Electrical Engineering & Computer Science
@MIT_CSAIL MIT Sloan School of Management & Laboratory for Financial Engineering
illions of dollars are spent annually on cancer drug development, yet effective treatments for many types of cancer remain as elusive as ever. Recently, the MIT Laboratory for Financial Engineering announced the launch of Project ALPHA (Analytics for Life-sciences Professionals and Healthcare Advocates), a large-scale estimation of clinical trial probabilities of success (PoS) for a variety of drug development programs, where a single program is defined as the set of all clinical trials corresponding to a unique drug-indication pair. In that study, we found that only 3.4 percent of all cancer drug development programs from 2000 to 2015 moved from phase 1 to regulatory approval, despite the fact that oncology accounted for 42 percent of all drug development programs in that dataset.
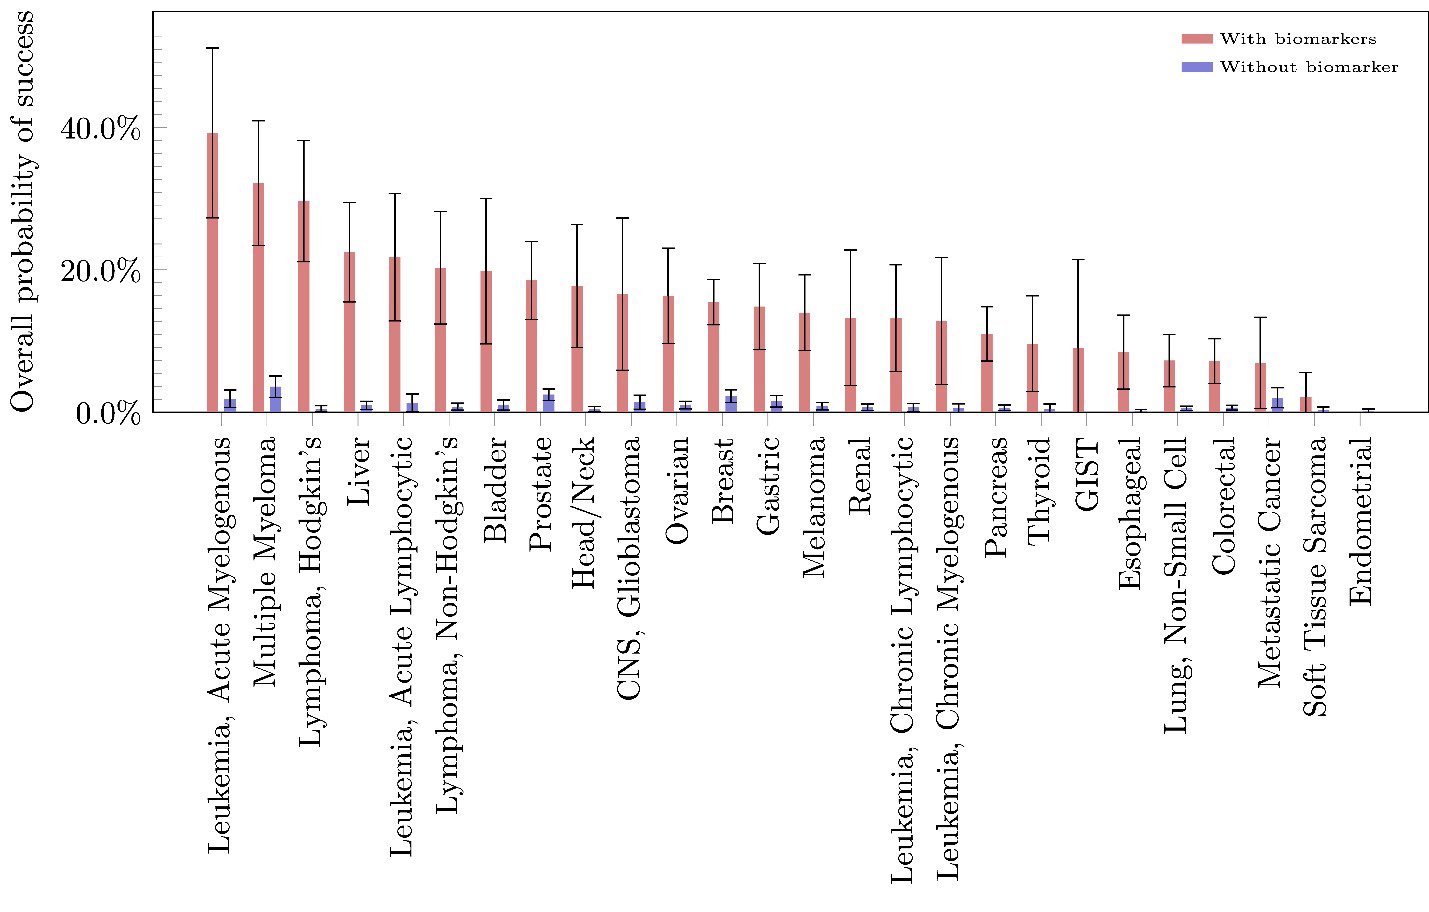
Although the overall estimated phase-1-to-approval PoS for all oncology-related drug development programs is 3.3 percent, individual diseases have estimated PoS ranging from 0 to 10.1 percent. Breast cancer has the highest estimated overall PoS, with 10.1 percent of its drug development programs moving from phase 1 to marketing approval. Conversely, there are diseases such as osteosarcoma for which no drug has gained approval in our sample. We find overwhelming evidence that using biomarkers in patient selection is effective in almost all diseases within oncology, raising the overall PoS of drug approval by an average of 13.3 percent and, in some diseases such as multiple myeloma and Hodgkin’s lymphoma, by more than twice that percentage. Finally, for orphan drug development in oncology, the estimated overall PoS ranges from 0 to 9.5 percent, with an overall average of 1.9 percent.
This article provides a summary of a follow-on study we conducted in which we estimated the PoS of drug development programs within the field of oncology. Using the same methodology as in Wong, Siah, and Lo (2019), we characterized the recent landscape of oncology clinical drug development, calculating several different measures of success, including the PoS by phase and cancer subtype. In addition, we computed these metrics for the subset of programs that used biomarkers in some phase of drug development, as well as for those programs involving rare and orphan cancers.
Estimating the PoS for drug development serves several important purposes. The truism that “you can’t manage what you don’t measure” is particularly relevant for drug development given the cost and complexity involved in a single clinical trial. More accurate estimates of PoS provide all stakeholders with useful benchmarks with which to make decisions about resource allocation, portfolio composition, and funding requirements. A comparison of PoS across indications can help regulators and policymakers direct public funding towards areas of greatest need, i.e., those diseases with the lowest likelihood of success and no available therapies. Finally, PoS estimates are critical to investors seeking to gauge their financial risk exposures when investing in a clinical program—the more accurately they can estimate these risks, the more likely that they will commit capital to this sector.
Several prior studies of clinical trial metrics have been conducted by various groups (among them, the Biotechnology Innovation Organization, McKinsey, and the Tufts Center for the Study of Drug Development) using datasets that are one to two orders of magnitude smaller than the dataset used in our study. We used Citeline data provided by Informa Pharma Intelligence, which combines individual clinical trial information from Trialtrove and drug approval data from Pharmaprojects and contains information from both US and non-US sources. We selected all trials with starting dates between 2000 and the third quarter of 2018 inclusive and filtered them for industry-sponsored trials relevant to cancer drug development. Data cleaning left us with 108,248 unique data points from which we identified 24,448 drug development programs across 40 different cancer subtypes.
We estimated the probability of a drug development program transitioning from phase i to phase j (PoSi,j) with the simple ratio Nj/Ni where Ni is the number of drug development programs initiated at phase i (where i = 1,2, or 3 ) and whose outcomes between phase i and phase j are known (where j = 2,3 or “A” which denotes regulatory approval), and Nj is the number of drug development programs among the former that made it to phase j. We call the estimated probability of a drug development program transitioning from phase i to phase i+1 the “phase i PoS,” and the “estimated overall PoS” is defined as the estimated probability of a drug development program going from Phase 1 to regulatory approval in at least one country. The estimated probability of a drug development program transitioning from phase 1 to approval—estimated directly using the approach described above—is called the “path-by-path” estimate of the overall PoS, and is reported for all the PoS calculations except for the case where we estimate the PoS of programs with and without biomarkers. The “phase-by-phase” estimate—in which the probability of phase 1 to approval is estimated as the product of PoS12, PoS23 , and PoS3A—is used for the biomarker analysis because biomarkers may not be used in all phases of a single drug development program (therefore, a path-by-path estimation of PoS with biomarkers would be based on a very small number of observations). It should be emphasized that because of how we treat missing clinical trial outcomes, path-by-path PoS estimates are not multiplicative (i.e., POS12 X PoS23 X PoS3A ≠ PoS1A , in contrast to phase-by-phase estimates, which do multiply (see Wong et al. 2019 and Project Alpha for details and simple illustrative examples)).
To simplify terminology, we will henceforth omit the qualifier “estimated” when referring to PoS so it should be understood that all PoS values reported in this article are statistical estimates of unobservable population parameters.
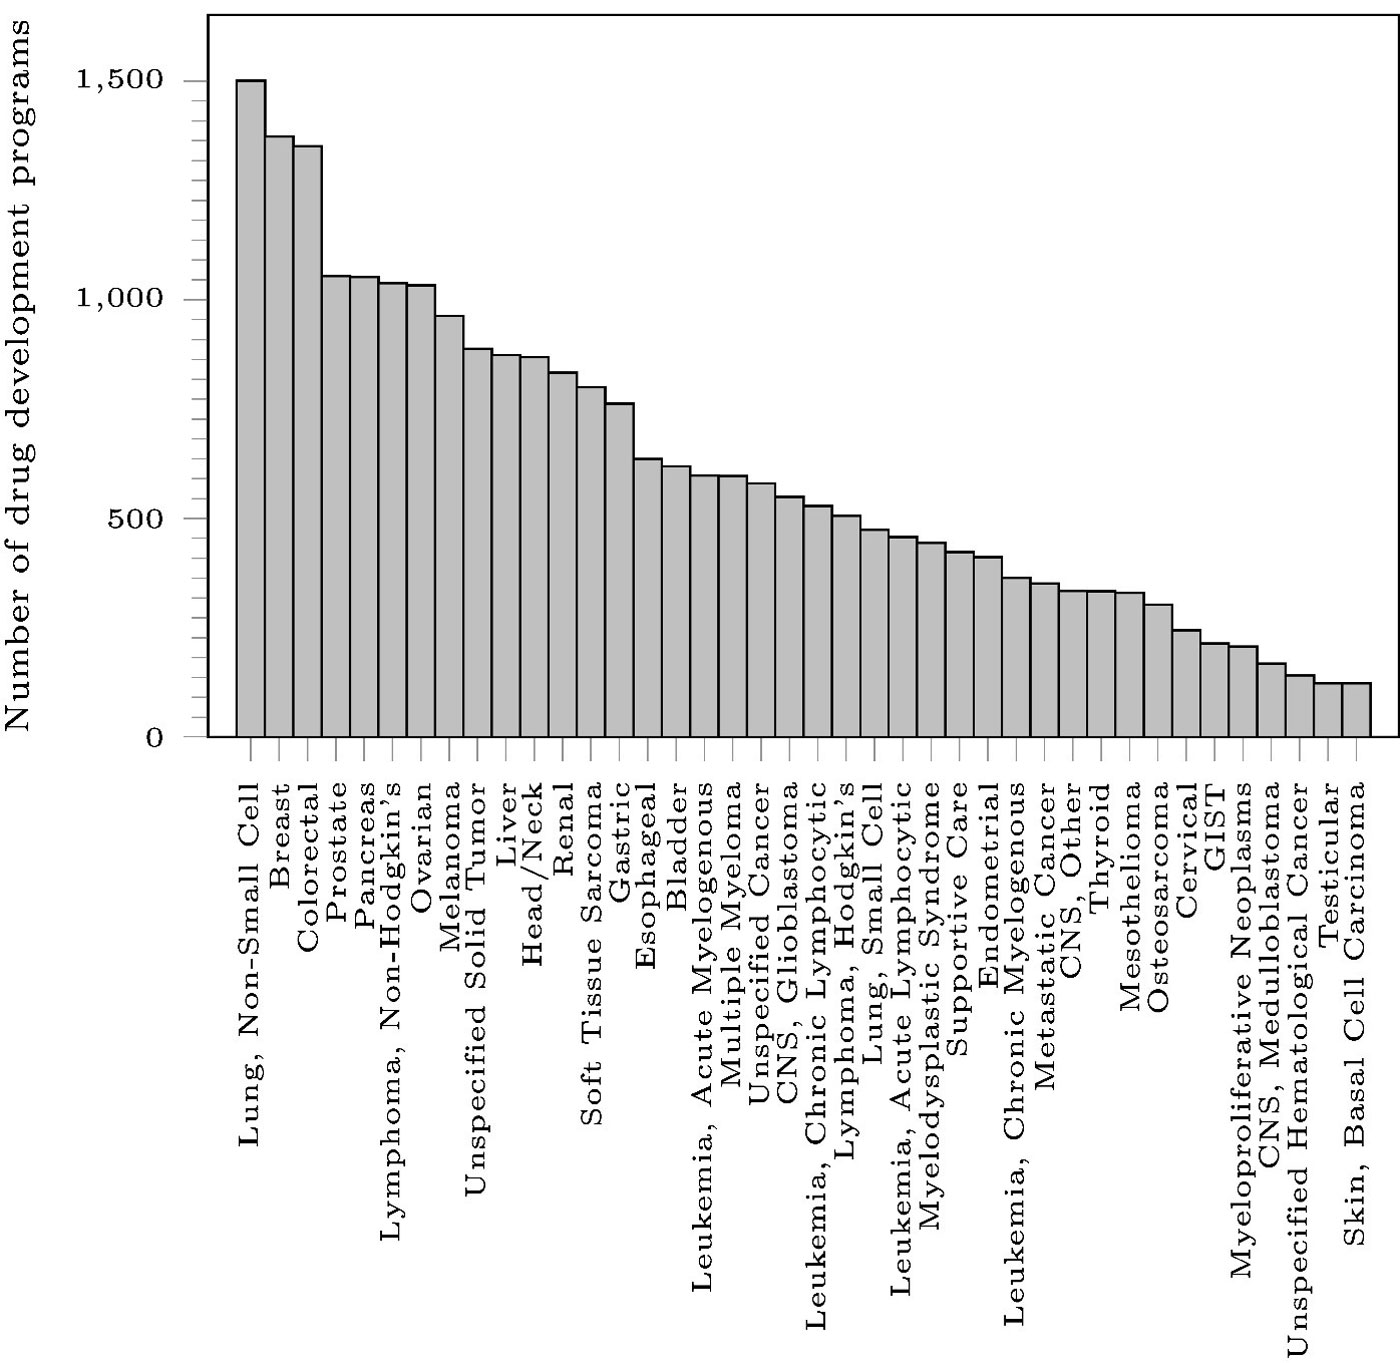
Figure 1 shows that the three oncological diseases with the largest number of drug development programs are non-small cell lung cancer (1,501), breast cancer (1,373), and colorectal cancer (1,351), while the three diseases with the fewest number of drug development programs are unspecified hematological cancer (141), testicular cancer (123), and basal cell carcinoma (123). Although the overall phase-1-to-approval PoS for all oncology-related drug development programs in our dataset is 3.3 percent (a slight decline from our earlier result, which only used data through 2015), individual diseases have PoS ranging from 0 to 10.1 percent. Across all the diseases, the probabilities of transitioning from phase 2 to approval and phase 3 to approval are 5.7 percent and 24.1 percent, respectively.
PoS varies significantly across phases and disease types. After eliminating drugs for use in supportive care, we found that drugs for breast cancer have the highest overall PoS, with 10.1 percent of its drug development programs moving from phase 1 to marketing approval. Conversely, there are disease types such as osteosarcoma for which no drug has received approval in our sample. Unfortunately, we did not detect any linear relationship between the number of development programs and the overall PoS. Similarly, we did not detect any pattern for the duration of trials across diseases. Within each disease, we saw a large range of trial durations, with some trials taking as much as 16 times the median duration of other trials within the same disease type.


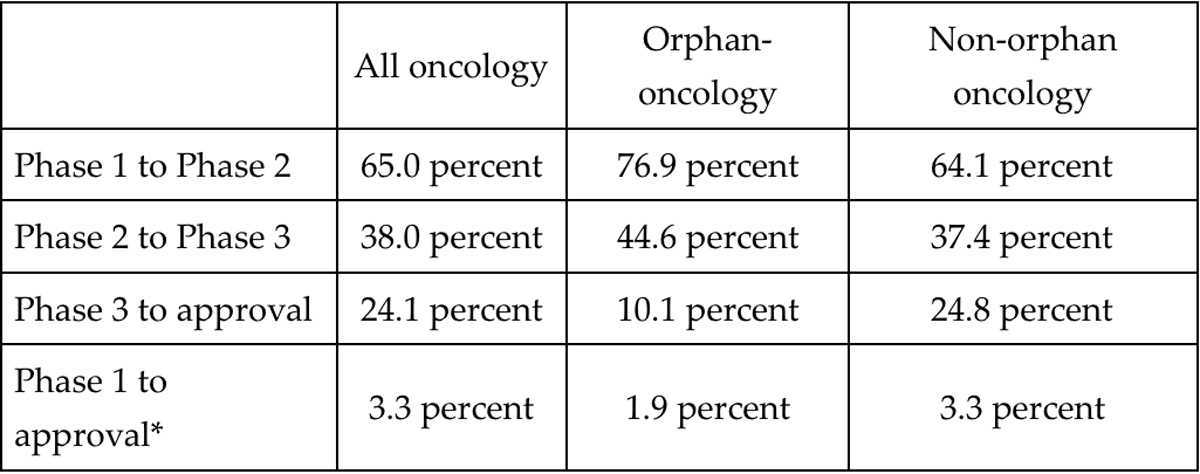
*Note: because these are path-by-path estimates, the overall PoS is not the product of the PoS of the three phases.
A closer look at the PoS by phase (Table 1) reveals that, while orphan-oncology drug-indication pairs have a higher phase-1-to-2 PoS (76.9 versus 65.0 percent) and phase-2-to-3 PoS (44.6 versus 38.0 percent) compared to oncology as a whole, a lower proportion of orphan development programs move from phase 3 to approval (10.1 versus 24.1 percent). The tighter bottleneck at phase 3 results in a lower overall PoS for orphan oncology drugs. Admittedly, this analysis suffers from a small sample size and may not reflect the true difficulties in developing drugs for orphan diseases.
These PoS results should be of interest to researchers, developers, policymakers, and investors alike. Not only does our breakdown of oncology drug development metrics demonstrate the large and significant benefit of using biomarkers during patient selection in the clinical trial process, it also shows evidence of a potential bottleneck in phase 3 for orphan drug development, which bears further investigation. We hope that more explicit quantification of the risk of drug development will lead to greater funding of promising projects in cancer drug development (e.g., through the securitization of R&D projects in this sector), and that our results assist the development of improved clinical trial designs, thus leading to greater and more efficient translation of biomedical research into effective therapies.
Acknowledgments
We thank Informa for providing us access to their data and expertise and are particularly grateful to Will Akie, Christine Blazynski, Mark Gordon, Michael Hay, and Ryan Sasaki for many helpful comments and discussion throughout this project. We also thank them and Alberto Grignolo, Gary Kelloff, David Parkinson, and Caroline Sigman for specific comments on this manuscript, and Jayna Cummings for editorial assistance. Research support from the MIT Laboratory for Financial Engineering and funding support from The Rockefeller Foundation are gratefully acknowledged. The views and opinions expressed in this article are those of the authors only, and do not necessarily represent the views and opinions of any institution or agency, any of their affiliates or employees, or any of the individuals acknowledged above.

