Digital QbD
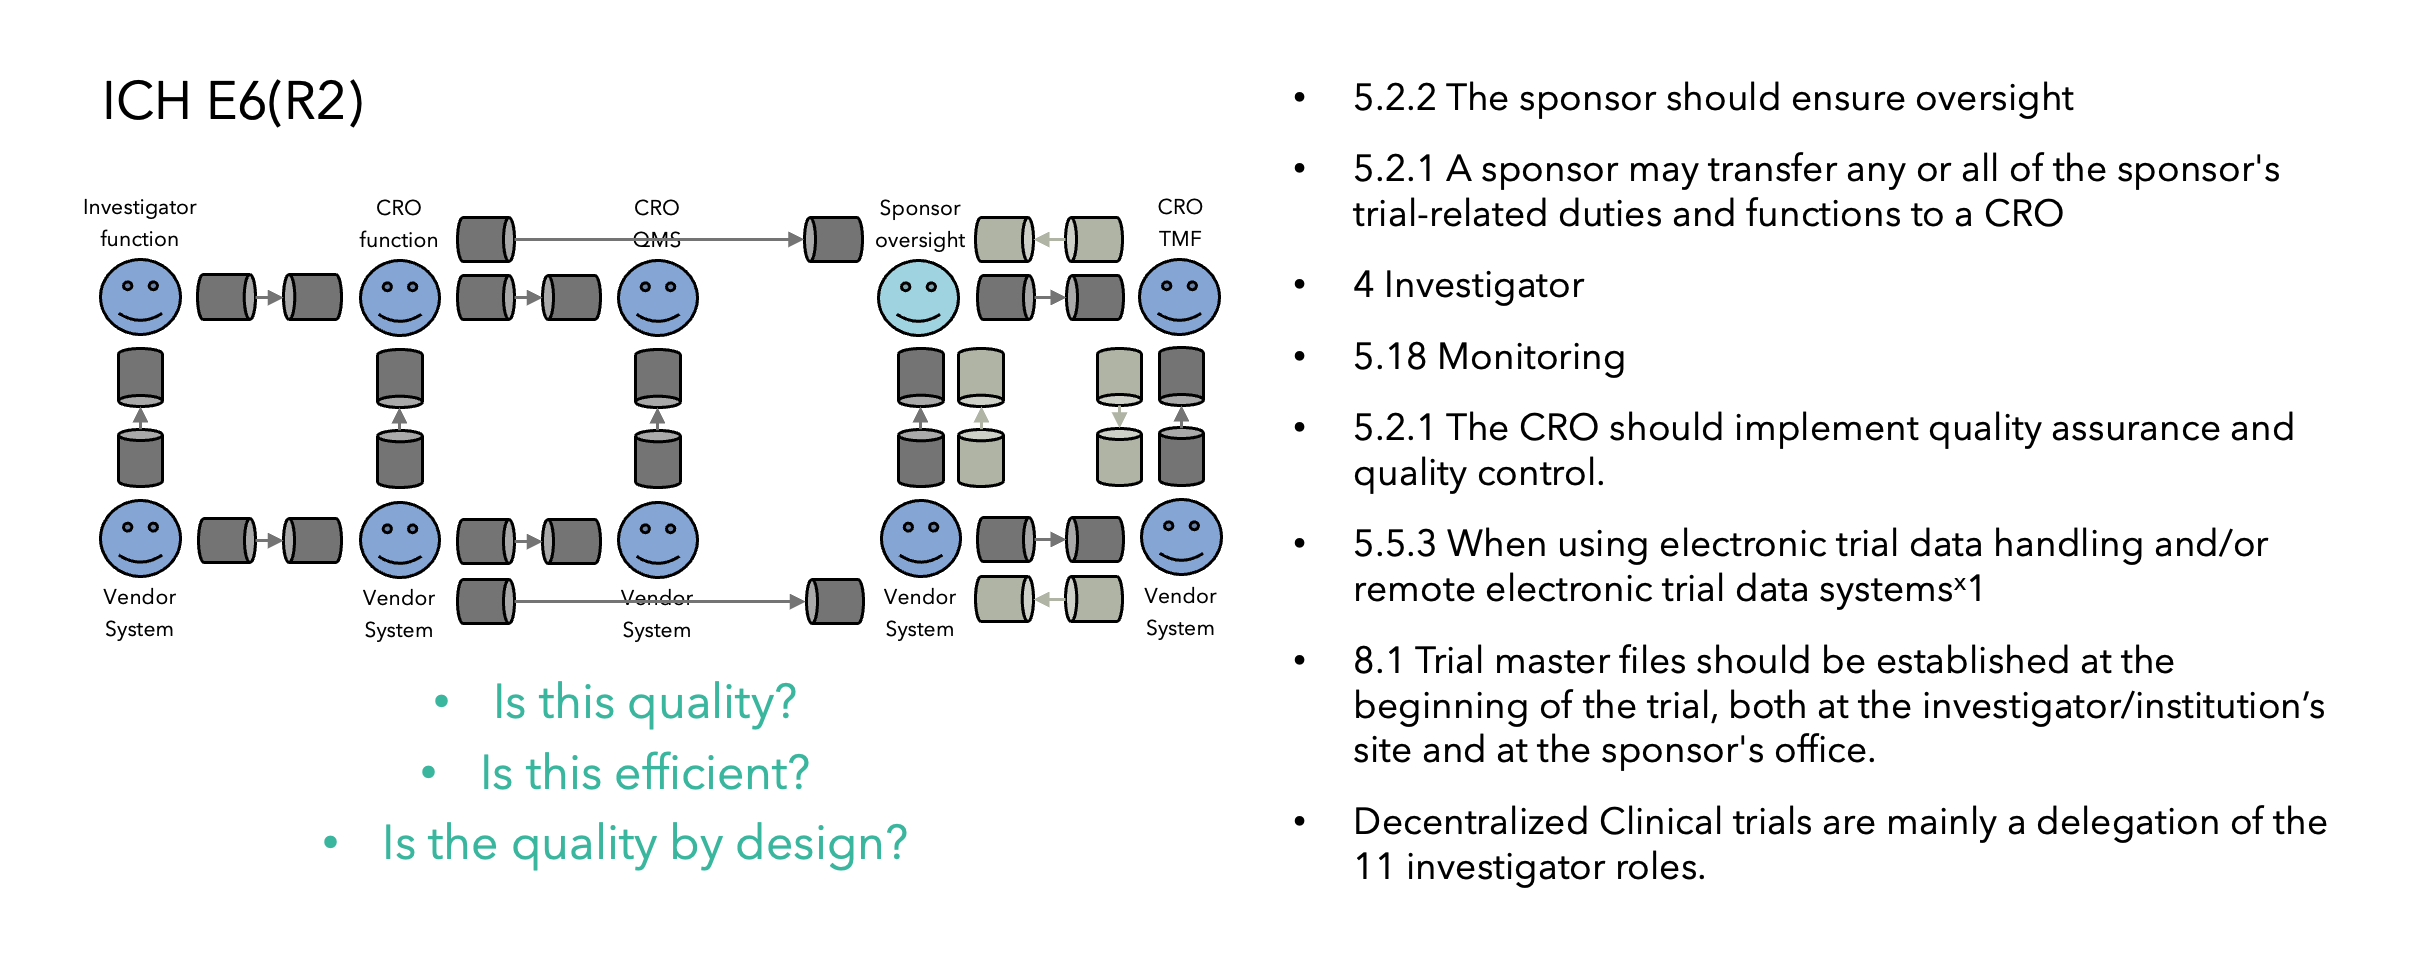
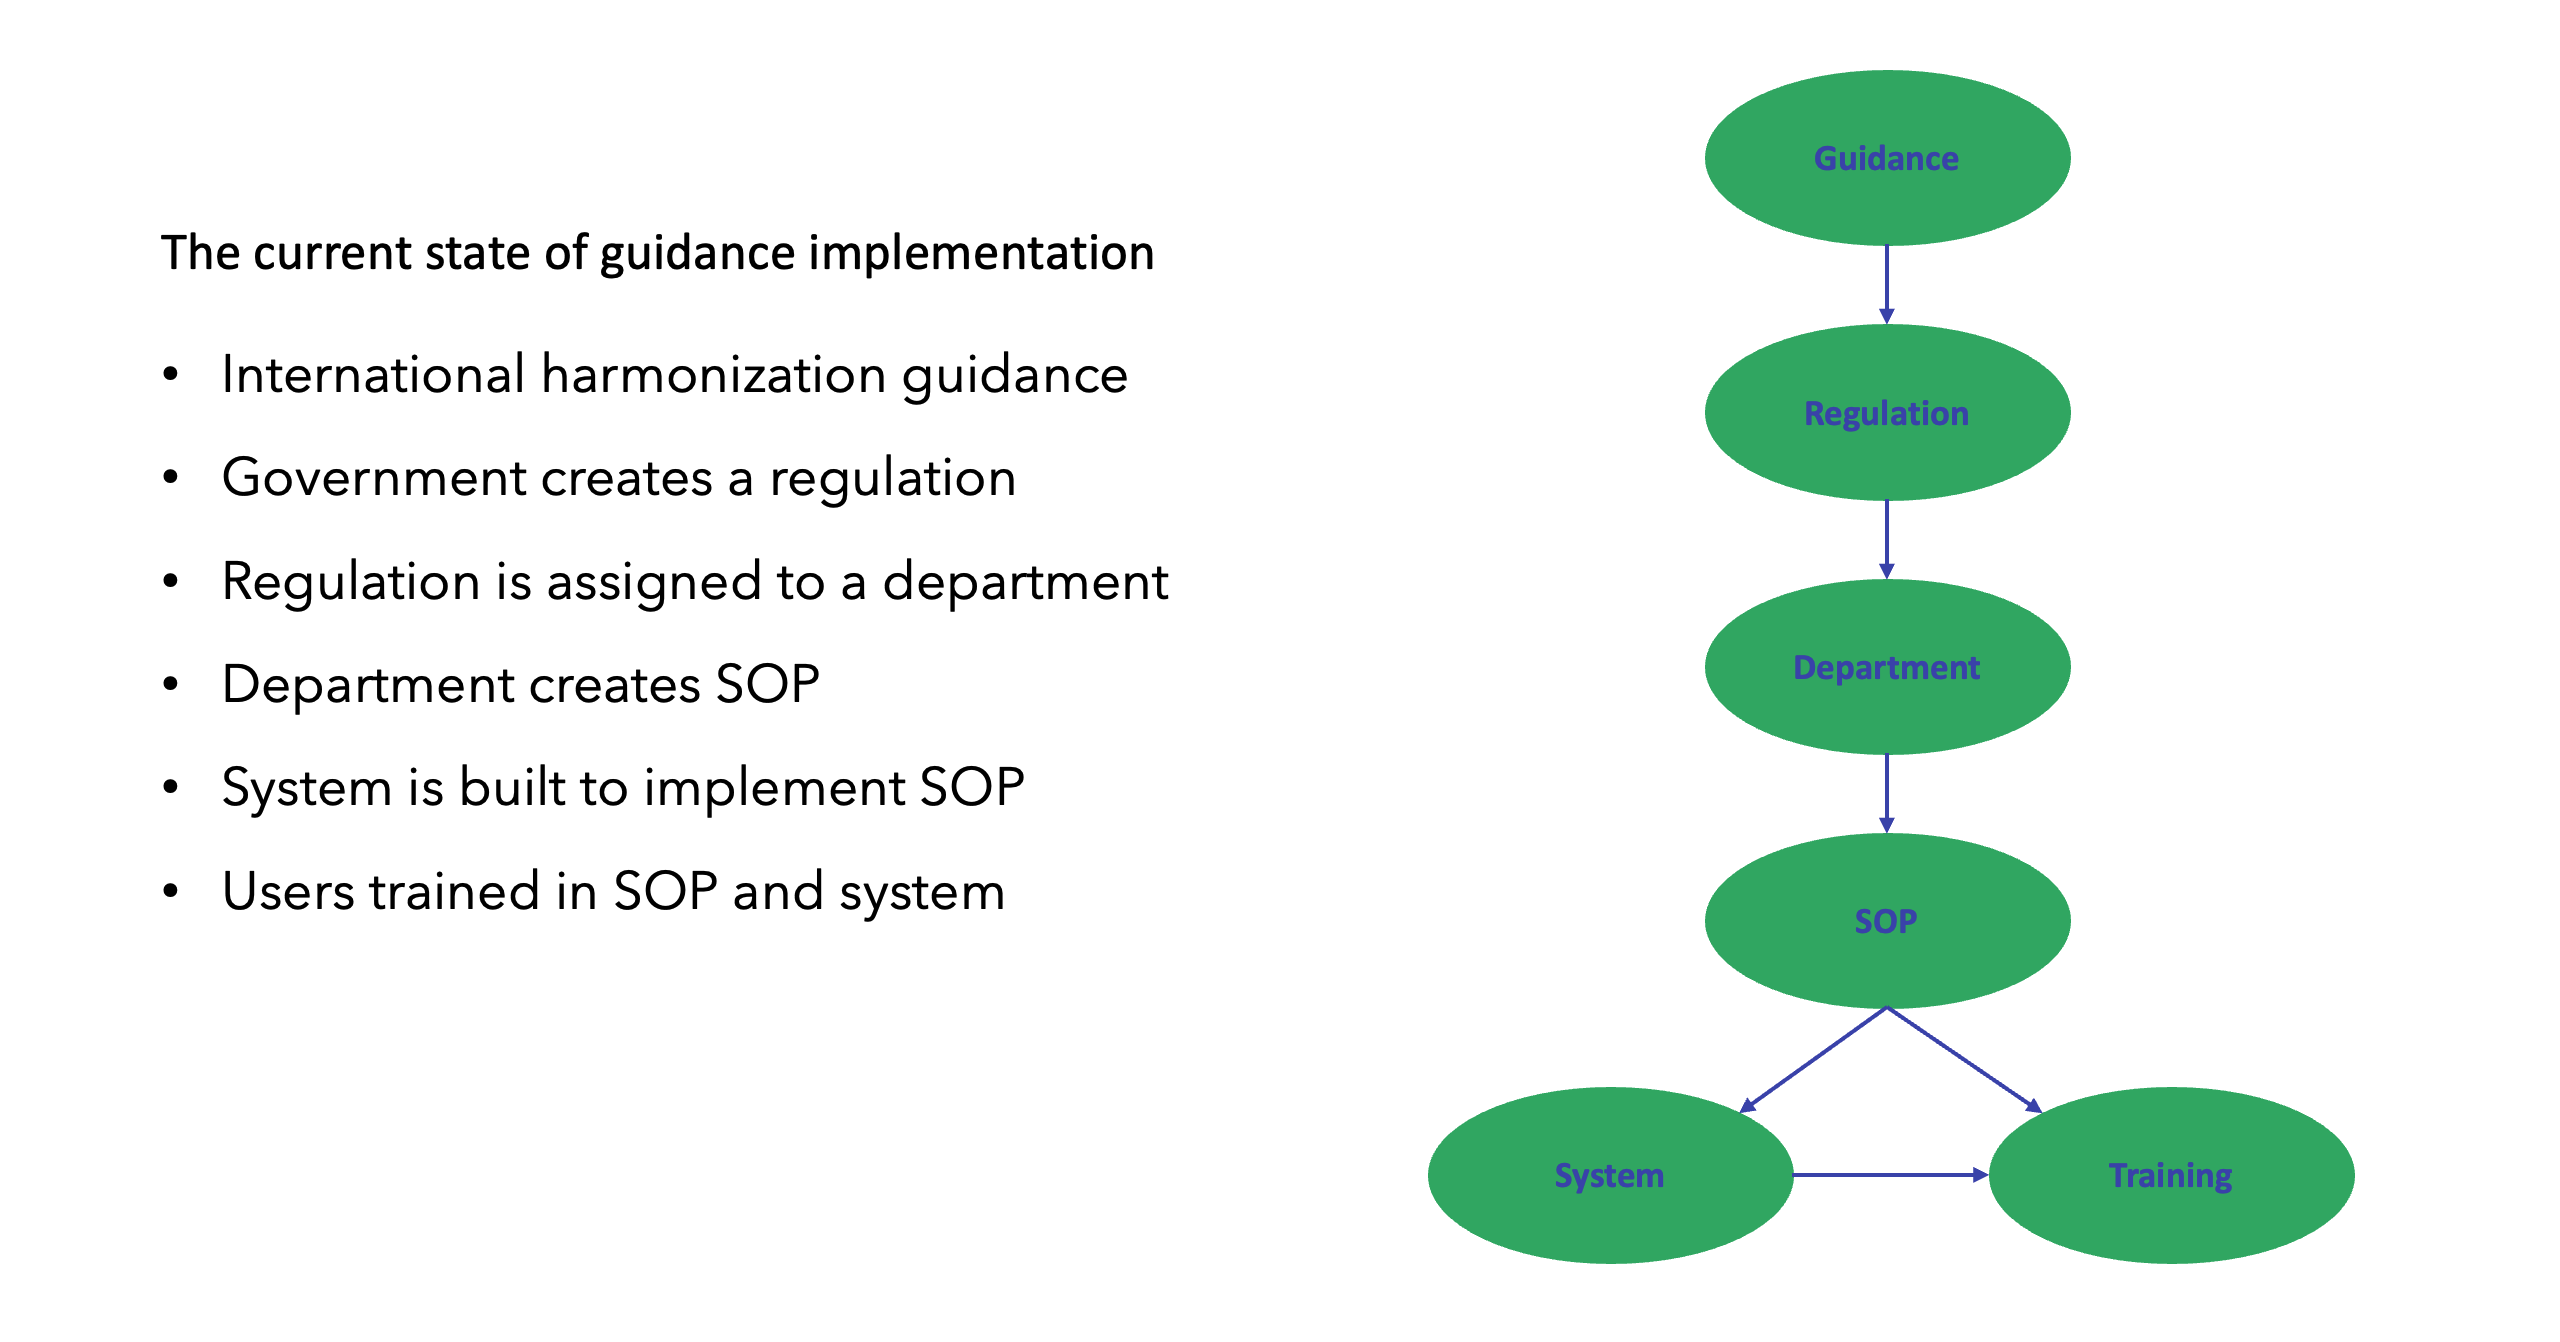
ood clinical practice (GCP) has been implemented solely by directives on how, what, and when specific documentation must be available, without any relation to operational study risks and mitigation. Protocols are designed too late in the process, with limited time to assess efficiency or operational feasibility. The result is an immobilized and tangled industry with localized regulations and inefficient standard operating procedures (SOPs), taking an average of seven years and over $2.9B to bring a medical product to market.
Can QbD be the panacea to untangle the current quality testing-based GCP? Yes, for two reasons. First, it provides an approach to identify risks many months before a protocol is approved. Second, it uses principles to design the simplest and most cost-effective solution to mitigate risks.
Examples of such early identifiable study risks are a need for novel or local Institutional Review Board (IRB) sites, IRB study disapproval from poor study quality, study participant underenrollment, and uncoordinated planning causing delays and unexpected costs. These can all be mitigated by study design optimization and review prior to the first protocol approval.
With QbD regulatory awareness, the onus is on the industry to implement changes that can reduce the cost and time to bring medical products to market.
Establishment of a QbD Culture
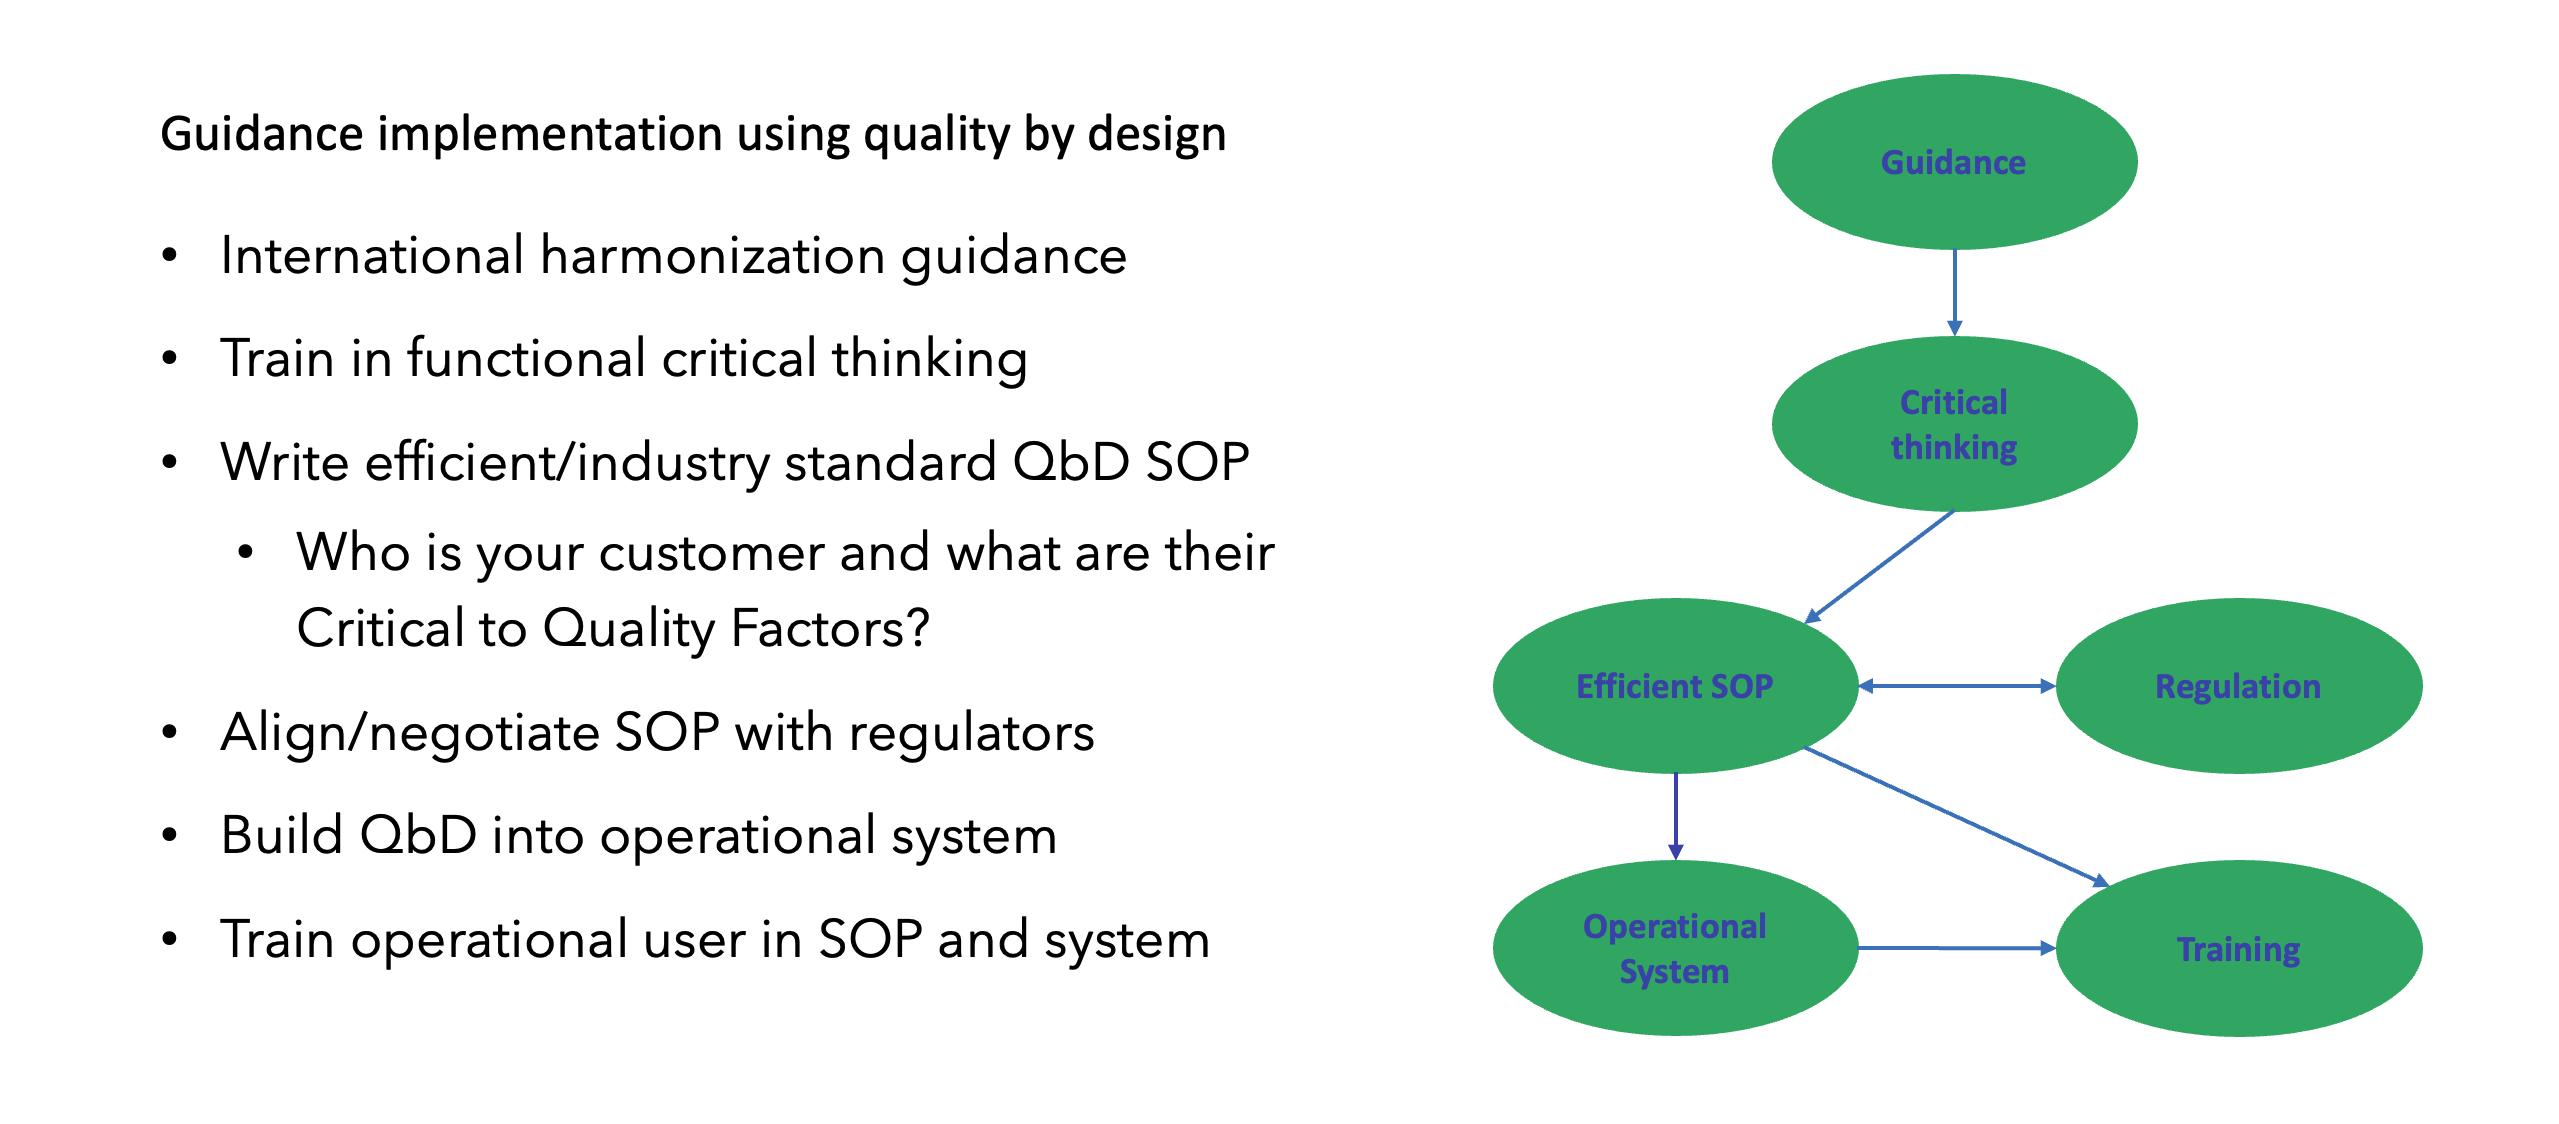
Having the freedom to set aspirational goals and the belief that significant changes can be implemented will drive a QbD team to think strategically. This enables critical thinking on how key components of the study processes can be optimized (Figure 3).
Today, the average study site startup time is 8 months. Is it possible to do it in 8 days? Yes, there are no regulatory constraints, it “just” requires that all study-related parties be informed by prevalidated digitalized study content to support automated and standardized processes.
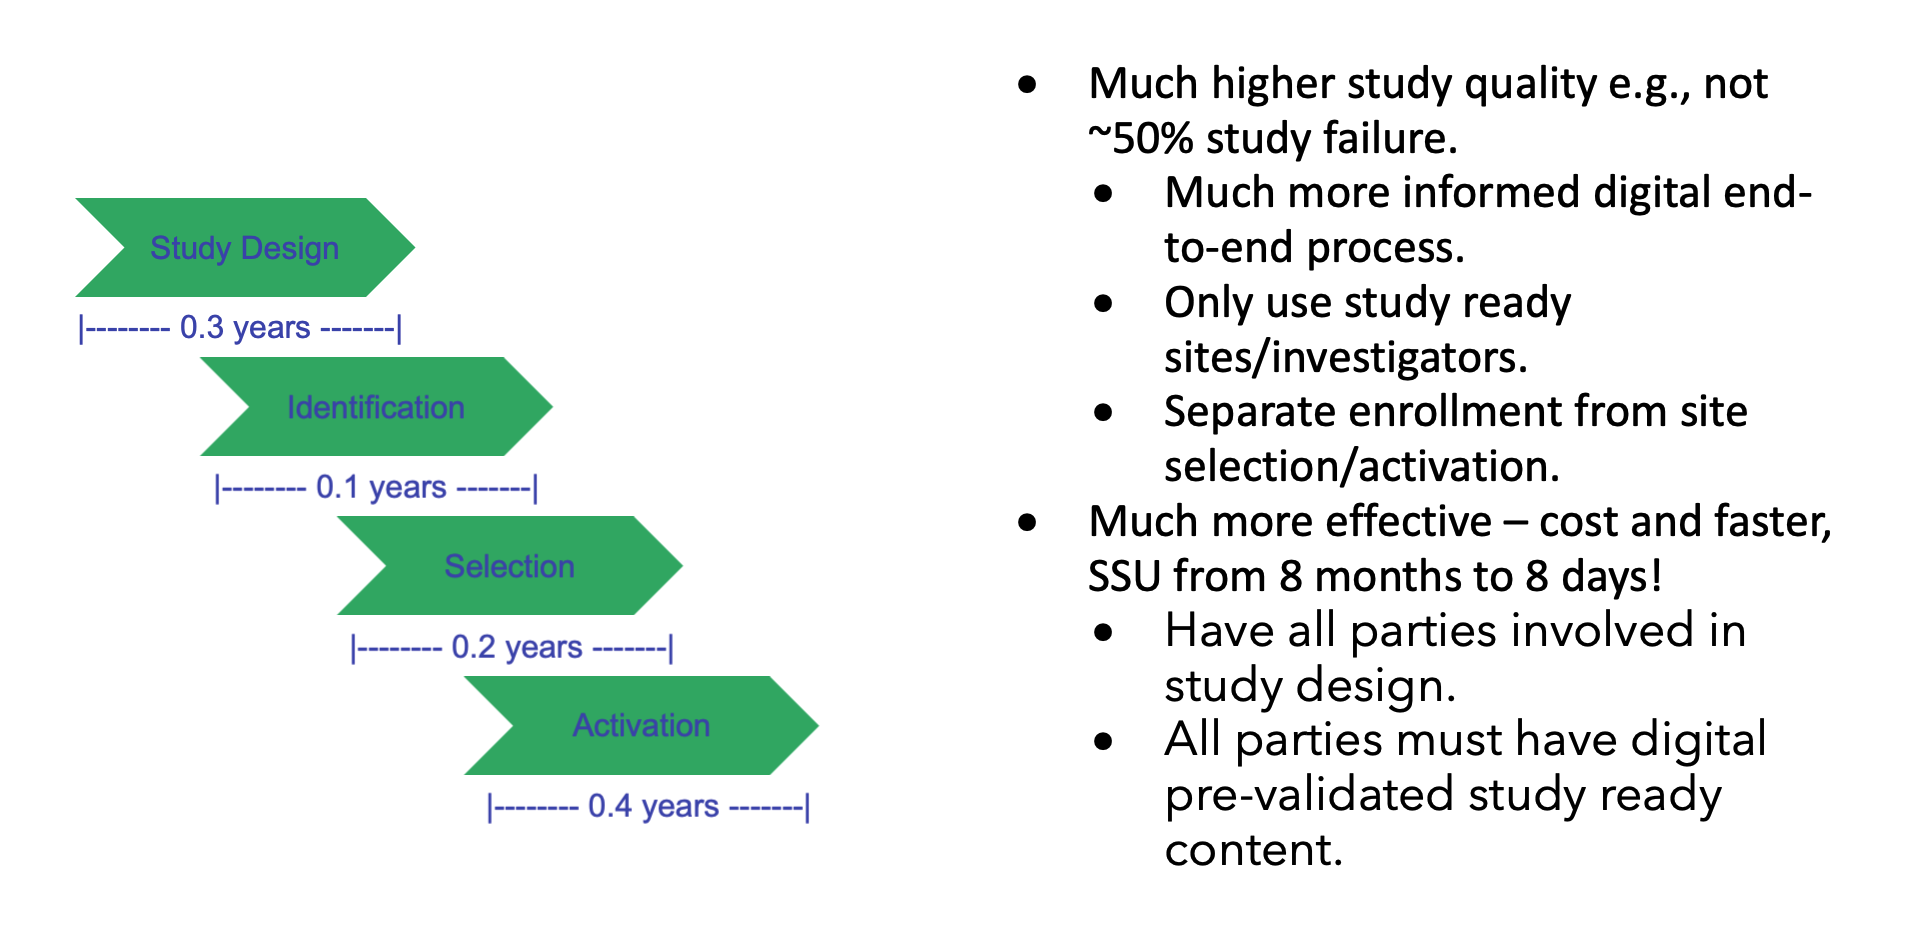
Study startup content is sourced over 90 percent electronically from Word, PDF, and Excel documents rather than being captured digitally in databases. Data are first transcribed into systems, such as study startup or clinical trial management systems, weeks or even months after being captured.
This is supported by the current industry standard for TMF inspection readiness, which is within 30 days of site activation milestone, with 52 percent (131 artifacts of the 250 Trial Master File (TMF) Reference Model V3.2.1) all still being electronic. Additionally, the Tufts Center for the Study of Drug Development (CSDD) found that in 2014-2018, it took an average of 145 days for the study startup period, up 13.7 percent from the prior 2008-2013 period. The only incentive for study specialists to transcribe content to systems are management reporting needs.
This lack of timely availability of data is a key obstacle in the implementation of QbD, as it requires real-time analytics to facilitate informed design optimization.
To enable end-to-end transparency for all parties, timely availability of standardized and digitalized features is paramount. This includes study features such as targeted medical conditions, main clinical objectives, population of trial subjects, eligibility criteria, approximate subject numbers, and treatment duration. This means that phase III and IV study design elements can start during clinical development planning more than a year in advance of current protocol approval.
Fortunately, industry solutions are already in progress, with the digital dataflow of study content driven by TransCelerate and the technical standardization led by the Clinical Data Interchange Standards Consortium (CDISC).
Make “Overall Efficiency” the Main Strategy.
The lack of available operational data to support accurate and transparent cross-functional planning toward study success has resulted in a focus on progress milestones, e.g., “first site activated,” determining that all study components are ready for activation of all sites. Reaching a progress milestone does not reflect on the overall quality of the study design nor the length of study timelines.
In contrast, changing the focus to “overall efficiency,” e.g., “last site activated,” establishes ownership on all relevant study components and enhances understanding on how the study design impacts them.
Furthermore, when quality is embedded into a study, progress becomes transparent, making “last site activated” and “last study participant” the key measures of “overall study efficiency” and success.
Quality by Design Implementation
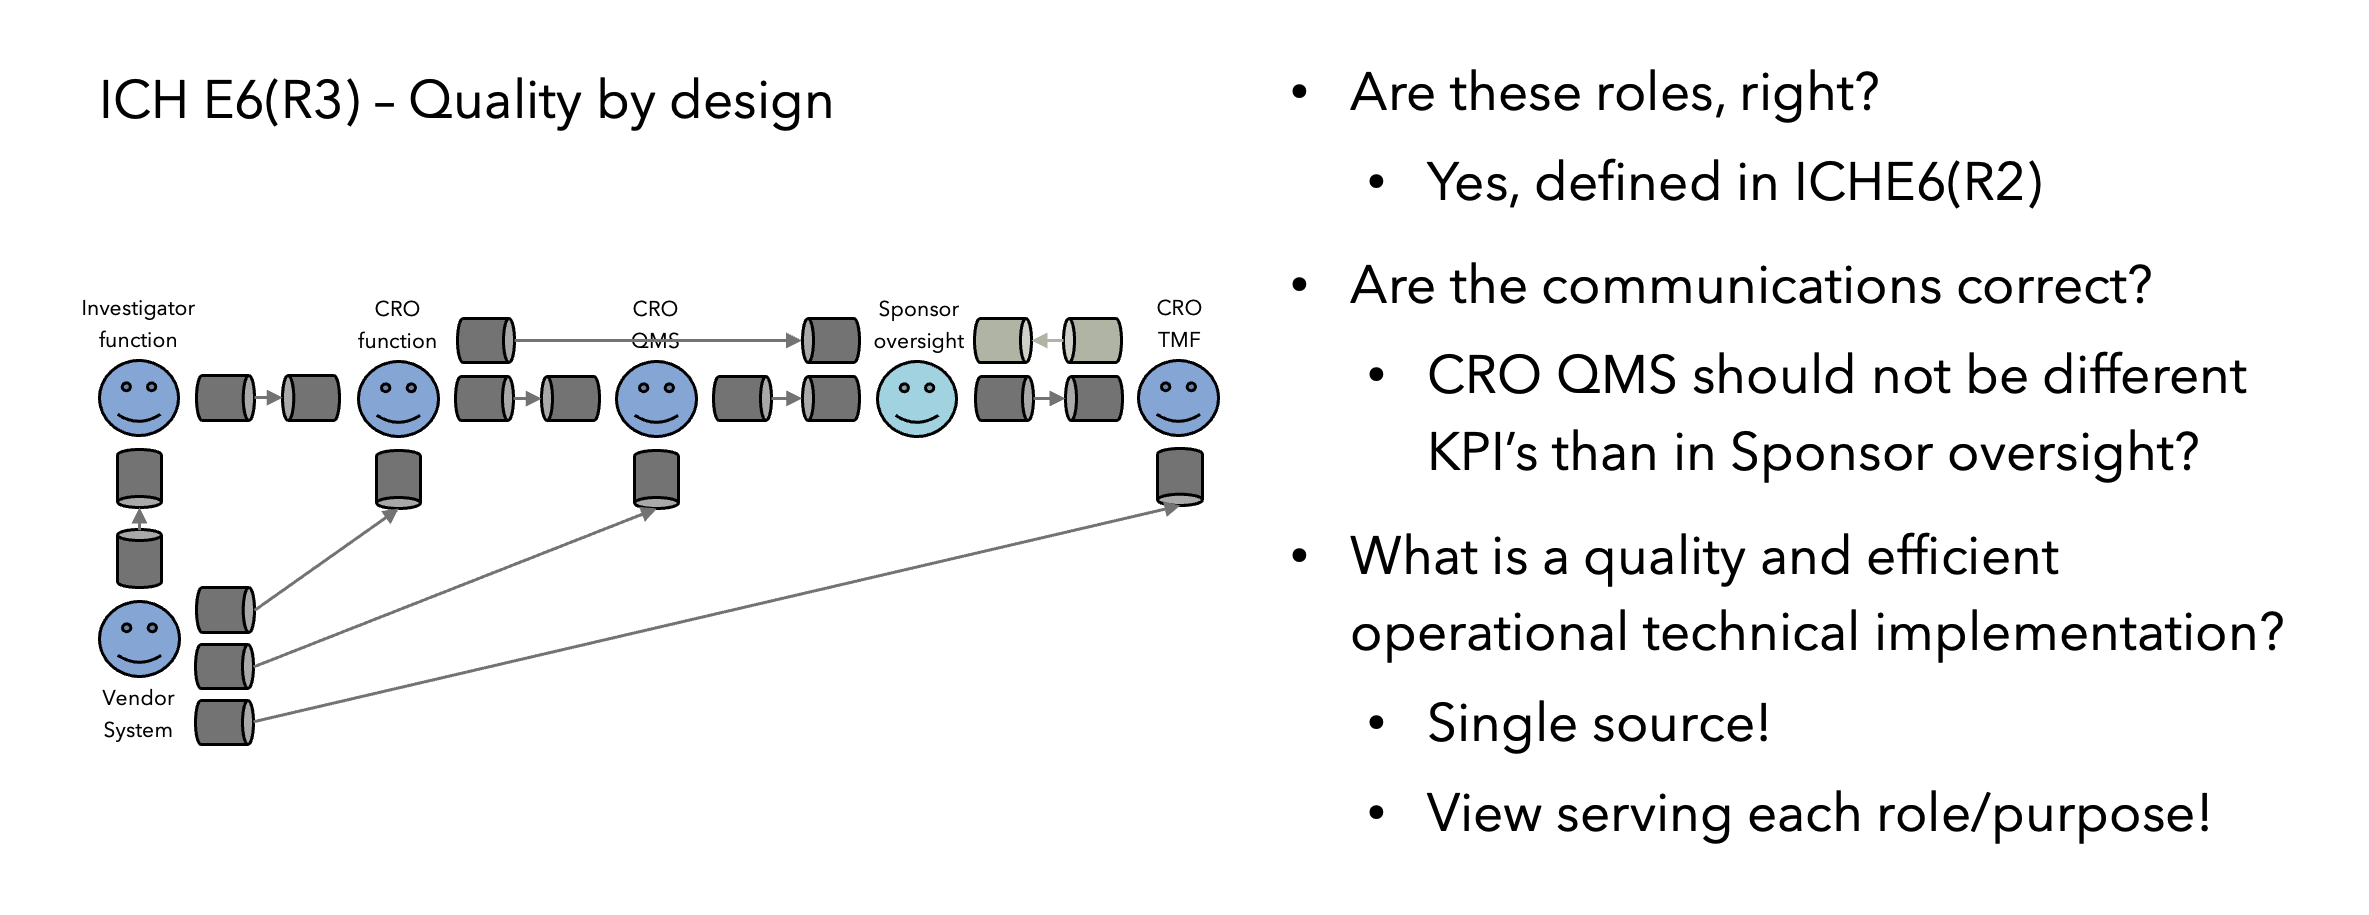
Fundamental changes such as QbD can’t be implemented without operational alignment and buy-in from entire organizations. This can be accelerated by some organizations which already have dedicated innovation groups for clinical research, and as operational innovation and critical thinking are the core elements of QbD, an innovation group is a perfect strategy to implement a QbD team, as illustrated in Figure 2.
As QbD is a new discipline, where GCP SOPs and critical thinking training have not been developed, it’s highly recommended to (1) bring external expertise to get the process started with established QbD principles empowering critical thinking; and (2) minimize resistance by avoiding impacting current operations or individual study teams (e.g., let them finish a study under the process they started with).
Start With a Risk That Can Provide Value Without Impacting Other Functional Areas
The European Medicines Agency (EMA) has, together with the Clinical Trial Regulation (CTR), taken a unique approach, requiring study content to be digitalized and standardized. In addition, the CTR imposes upfront penalties when submitting poor-quality study content, as this may result in severe overall study timeline penalties (e.g., 3, 6, or 9 months).
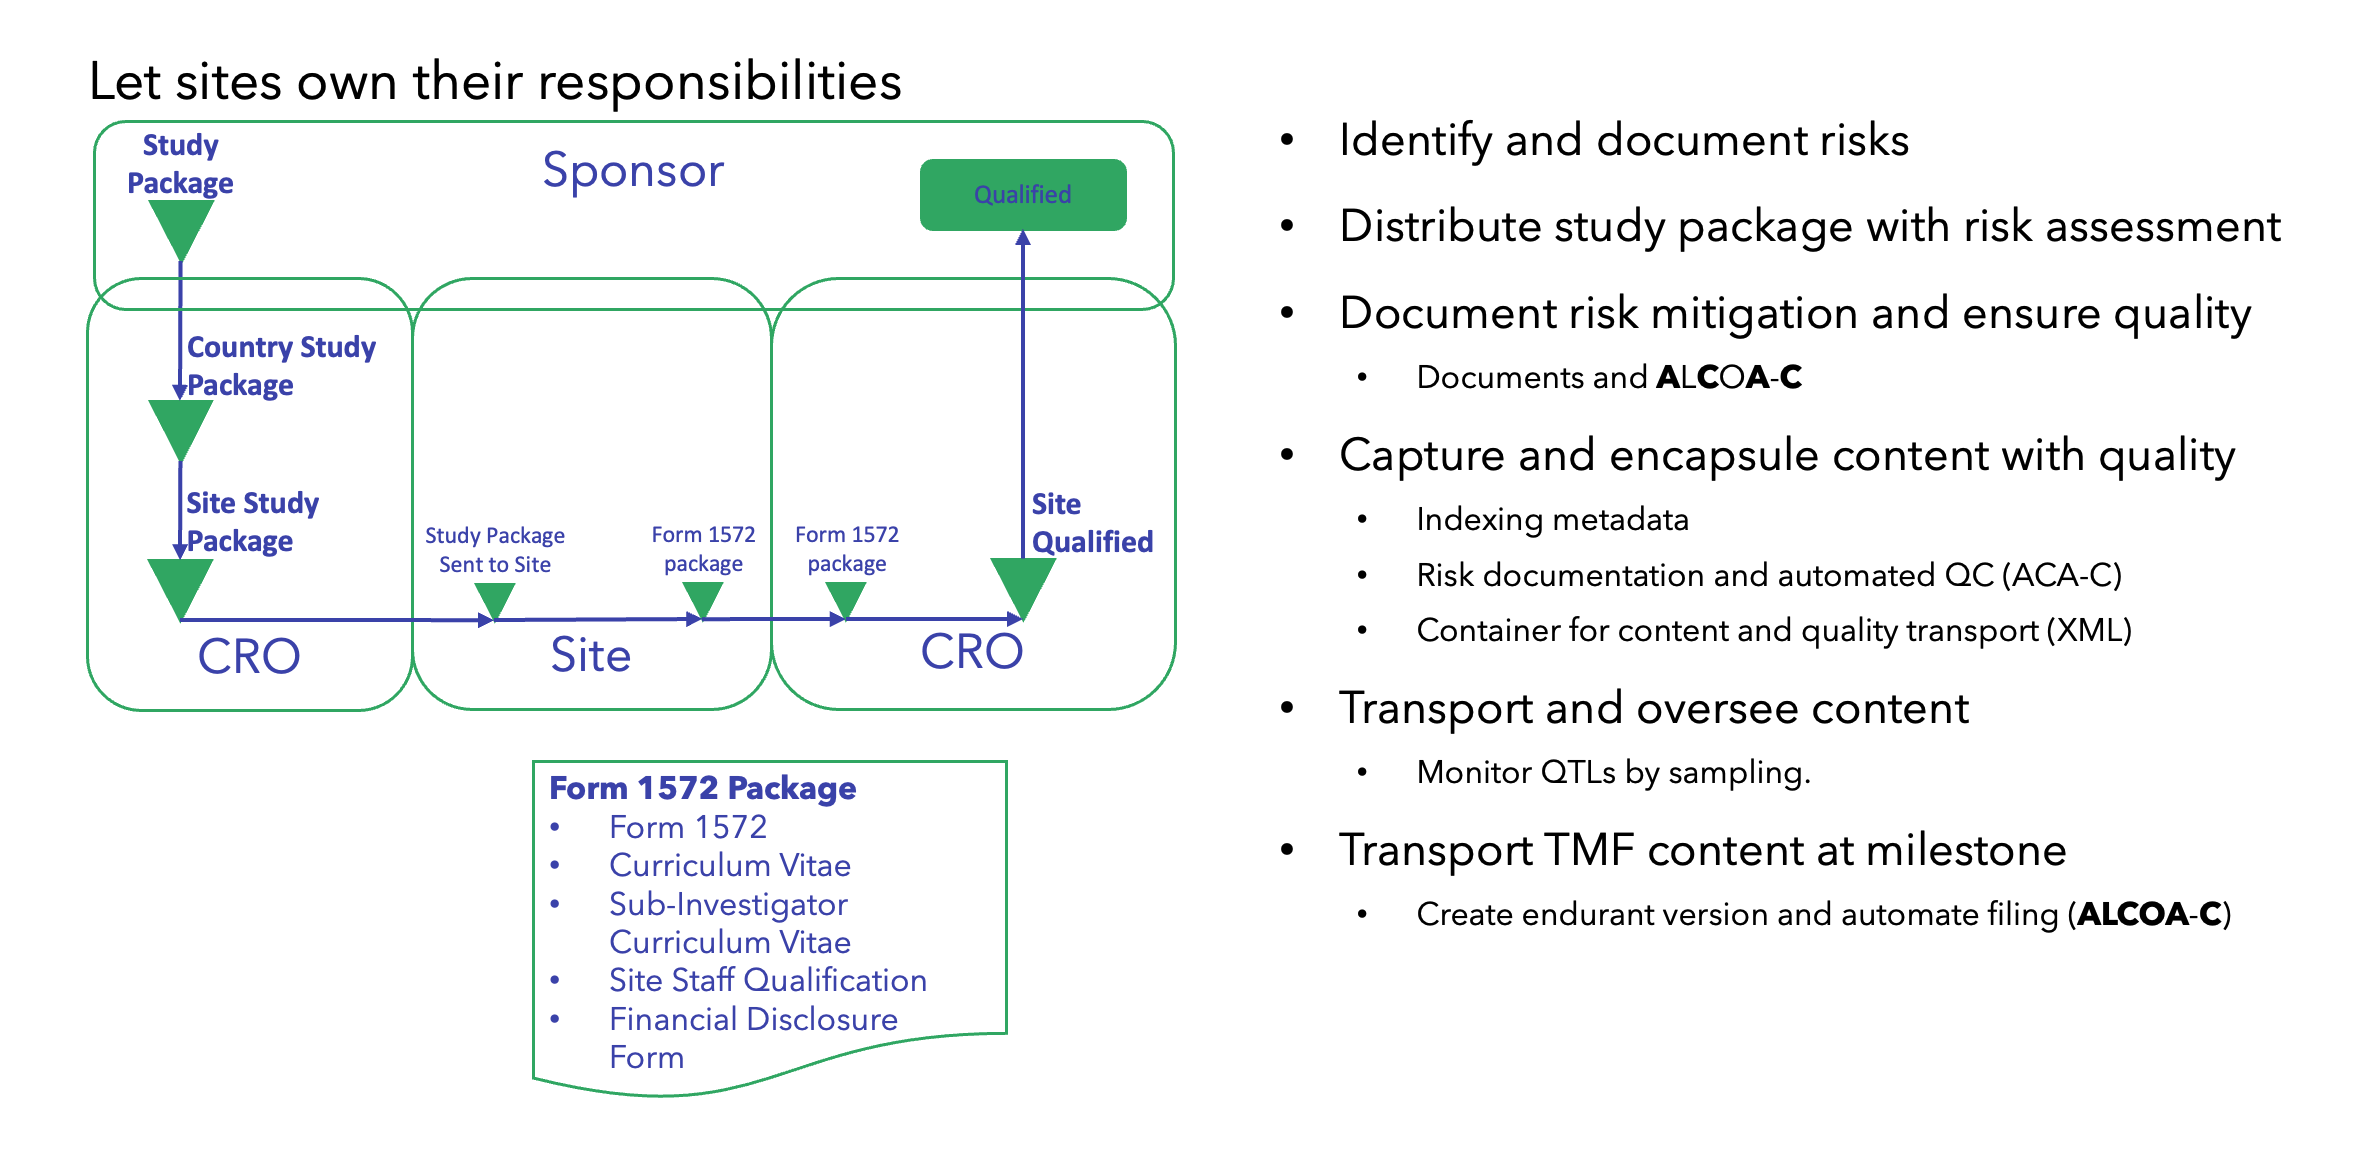
These elements make CTR conducive to achieving success based on a QbD approach. More importantly, this use case can show significant measurable benefits over industry averages, while at the same time establishing standardized and digitalized study content.
The QbD-based CTR implementation of standardized digital study content may then serve as a platform and model for future QbD process optimizations across all functional areas, as illustrated in Figures 4, 5, and 6.
